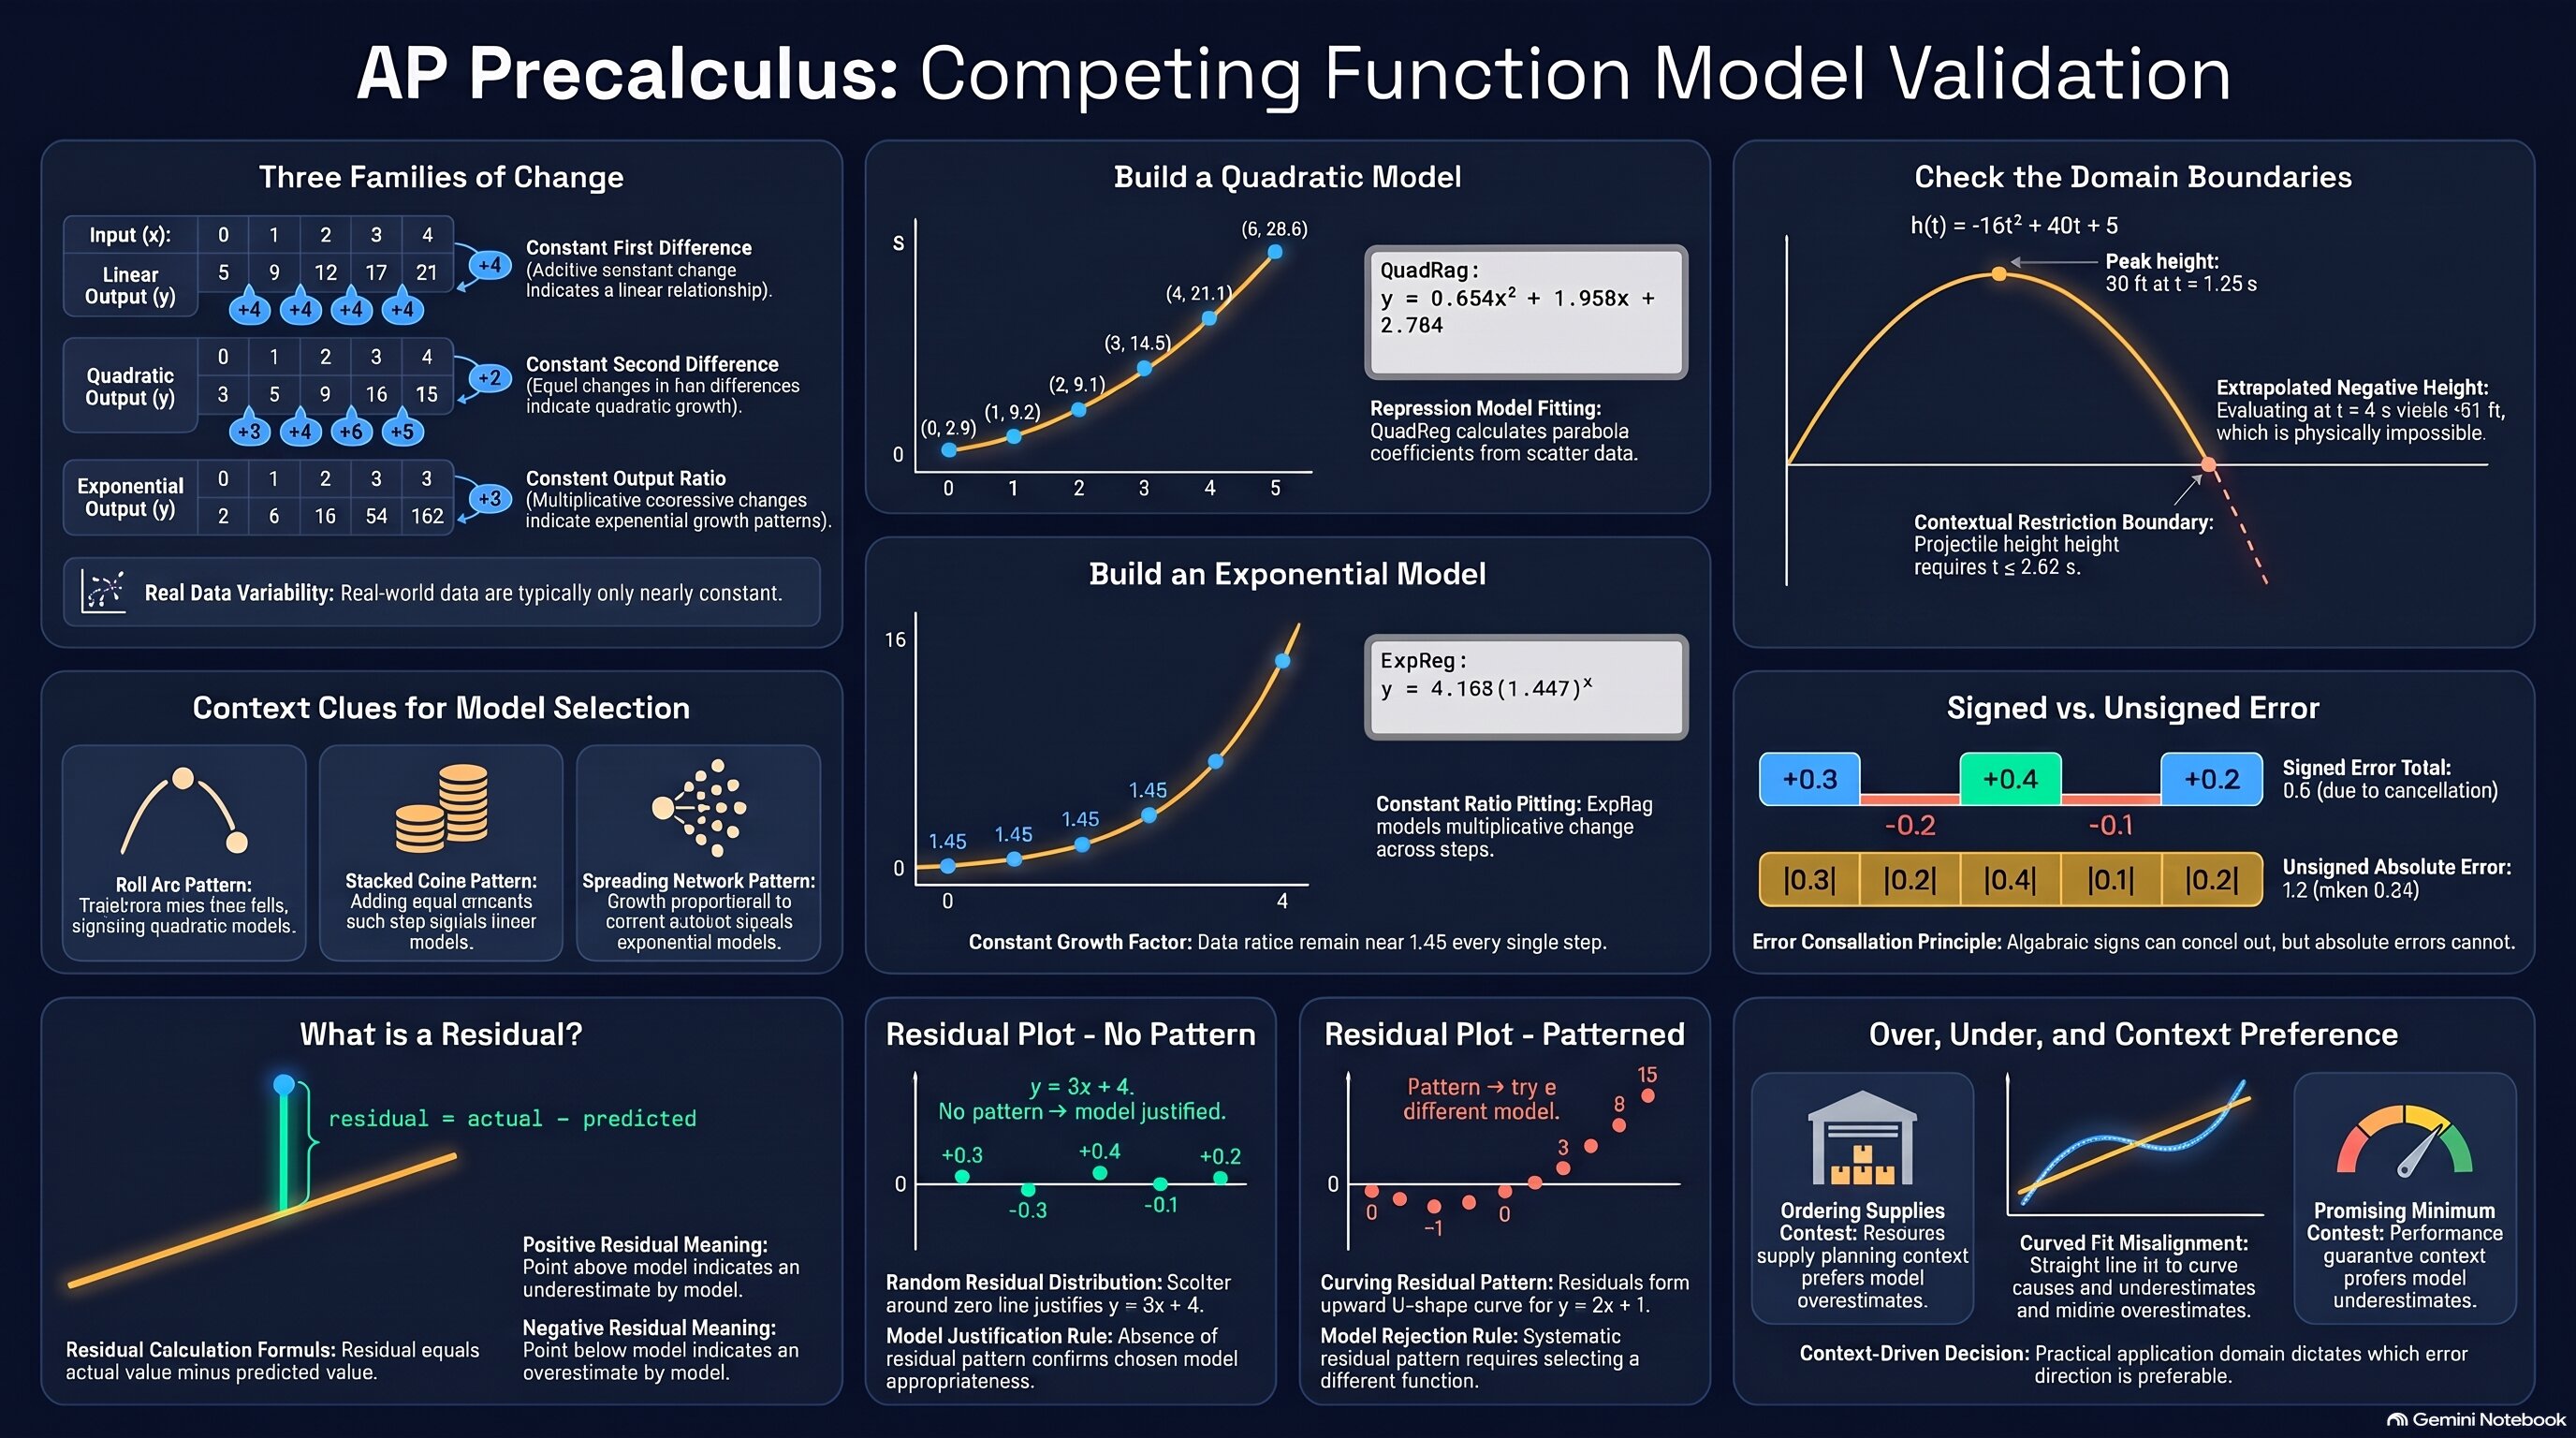
Use this as a quick reference for the three kinds of model, choosing one from the context, residuals and residual plots, and over- and underestimates.
🧭 Plot Summary
Real data is messy. A table of values may fit a line, a parabola, or an exponential curve almost equally well, so how do you decide? In this lesson you build linear, quadratic, and exponential models for the same data, use the context to pick the one that makes sense, and then validate it. A residual is the actual value minus the predicted value. If the residual plot shows no pattern, the model is justified. You will also describe errors as signed or unsigned, find where a model underestimates or overestimates, and decide which mistake the situation can afford.
What you'll do in this lesson
Recognize when data with a slightly changing rate of change fits a linear, quadratic, or exponential model.
Construct all three kinds of model for a data set, using technology.
Use the context of the situation to choose the most appropriate model, and check predictions for sense.
Compute residuals and read a residual plot to decide whether a model is justified.
Describe signed and unsigned errors, and say where a model underestimates or overestimates.
Decide from the context whether an underestimate or an overestimate is the better mistake.
Why it matters
A ball in the air, a savings account, and a video going viral each call for a different model. A model that fits the points can still be the wrong one, so the skill is choosing carefully and checking the work with residuals. The next topics build toward composition, inverse functions, and logarithms.
✅ Self-Check Before You Move On
Check off each item as you get there. These aren't grades — they're your own signal.