Use this as a quick reference for limit notation at both ends, the leading term dominating, the four end-behavior patterns, and reading ends from graphs.
🧭 Plot Summary
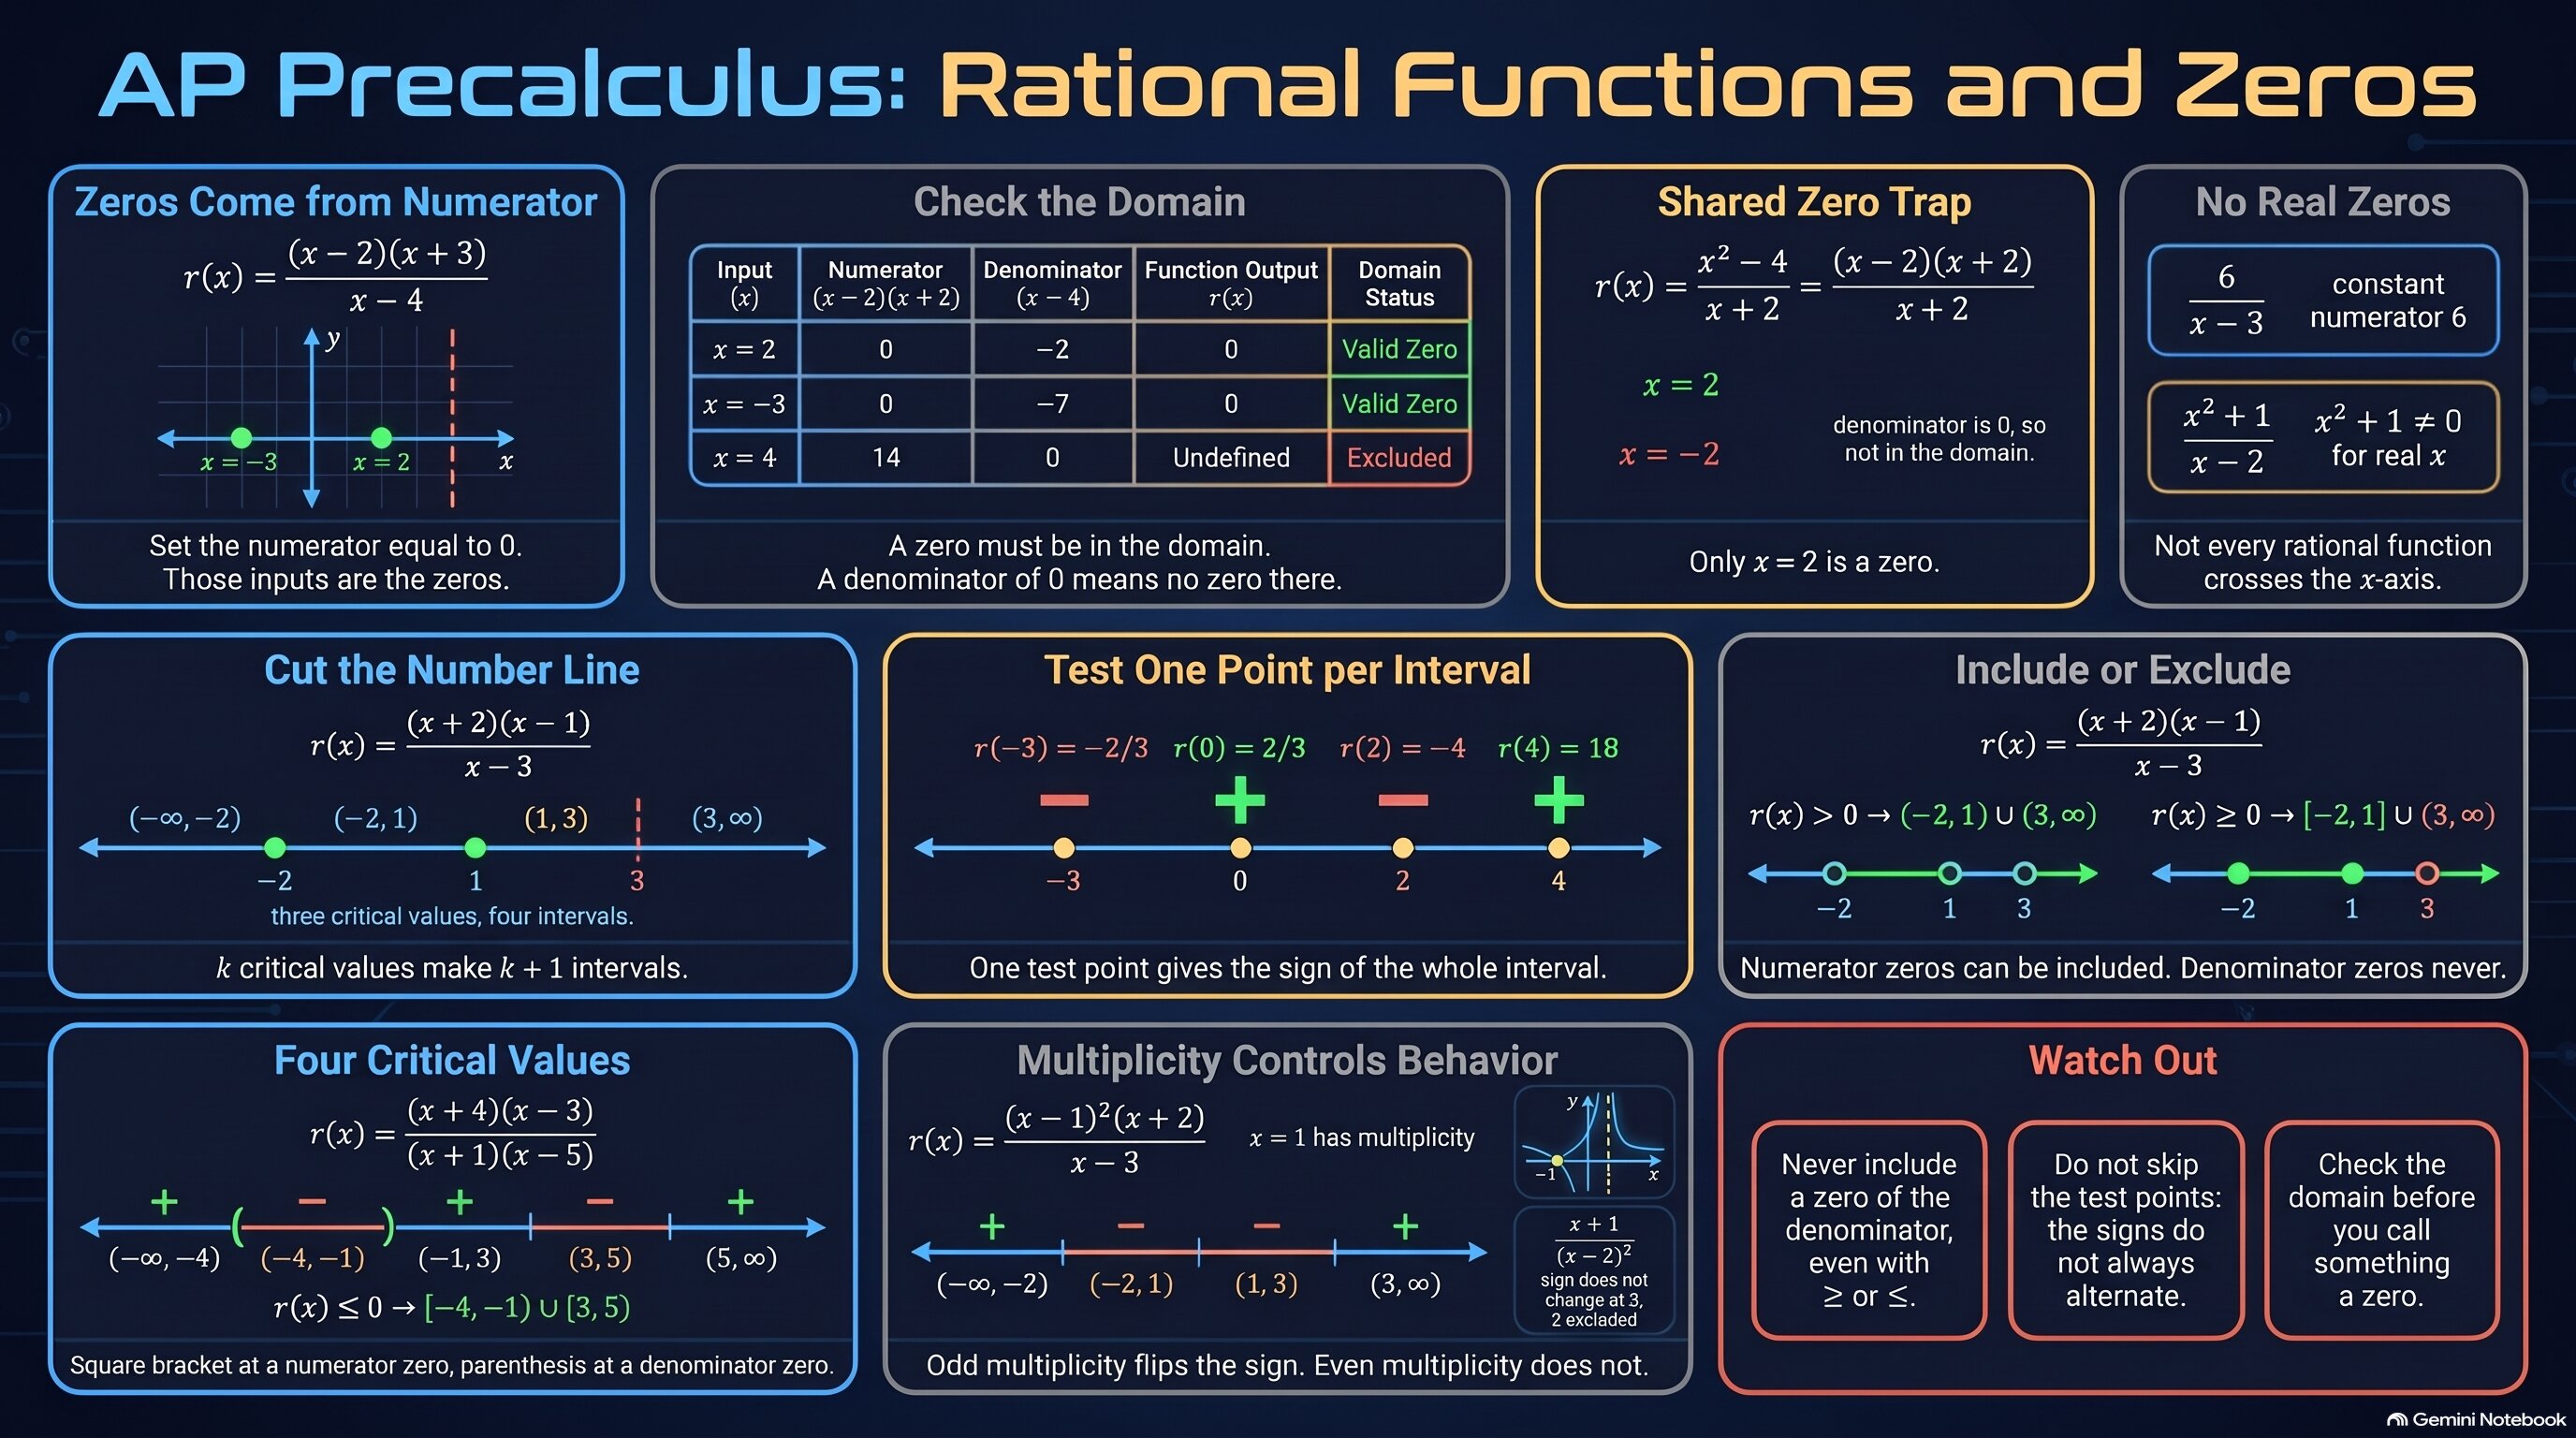
Lesson 1.7 asked what a rational function does far out. Now ask where it equals zero, and where it is positive or negative. Because a fraction is 0 only when its top is 0, the real zeros of r are the real zeros of the numerator (as long as they are in the domain). The zeros of both polynomials then cut the number line into intervals, where r keeps one sign, so you can solve r(x) ≥ 0 and r(x) ≤ 0 with a sign chart.
What you'll do in this lesson
Find the real zeros of a rational function from its numerator.
Check each candidate against the domain.
Mark the zeros of the numerator and the denominator on a number line.
Test one point in each interval to get the sign of r.
Write the solutions of r(x) ≥ 0 and r(x) ≤ 0 in interval notation.
Use multiplicity to predict when the sign changes.
Why it matters
Many questions ask "when is this quantity positive?" or "when does it break even?": when a ratio of profit to cost is above zero, or when a concentration model is nonnegative. A sign chart turns those questions into a short routine. Lesson 1.9 will study what the graph does near the zeros of the denominator.
✅ Self-Check Before You Move On
Check off each item as you get there. These aren't grades — they're your own signal.