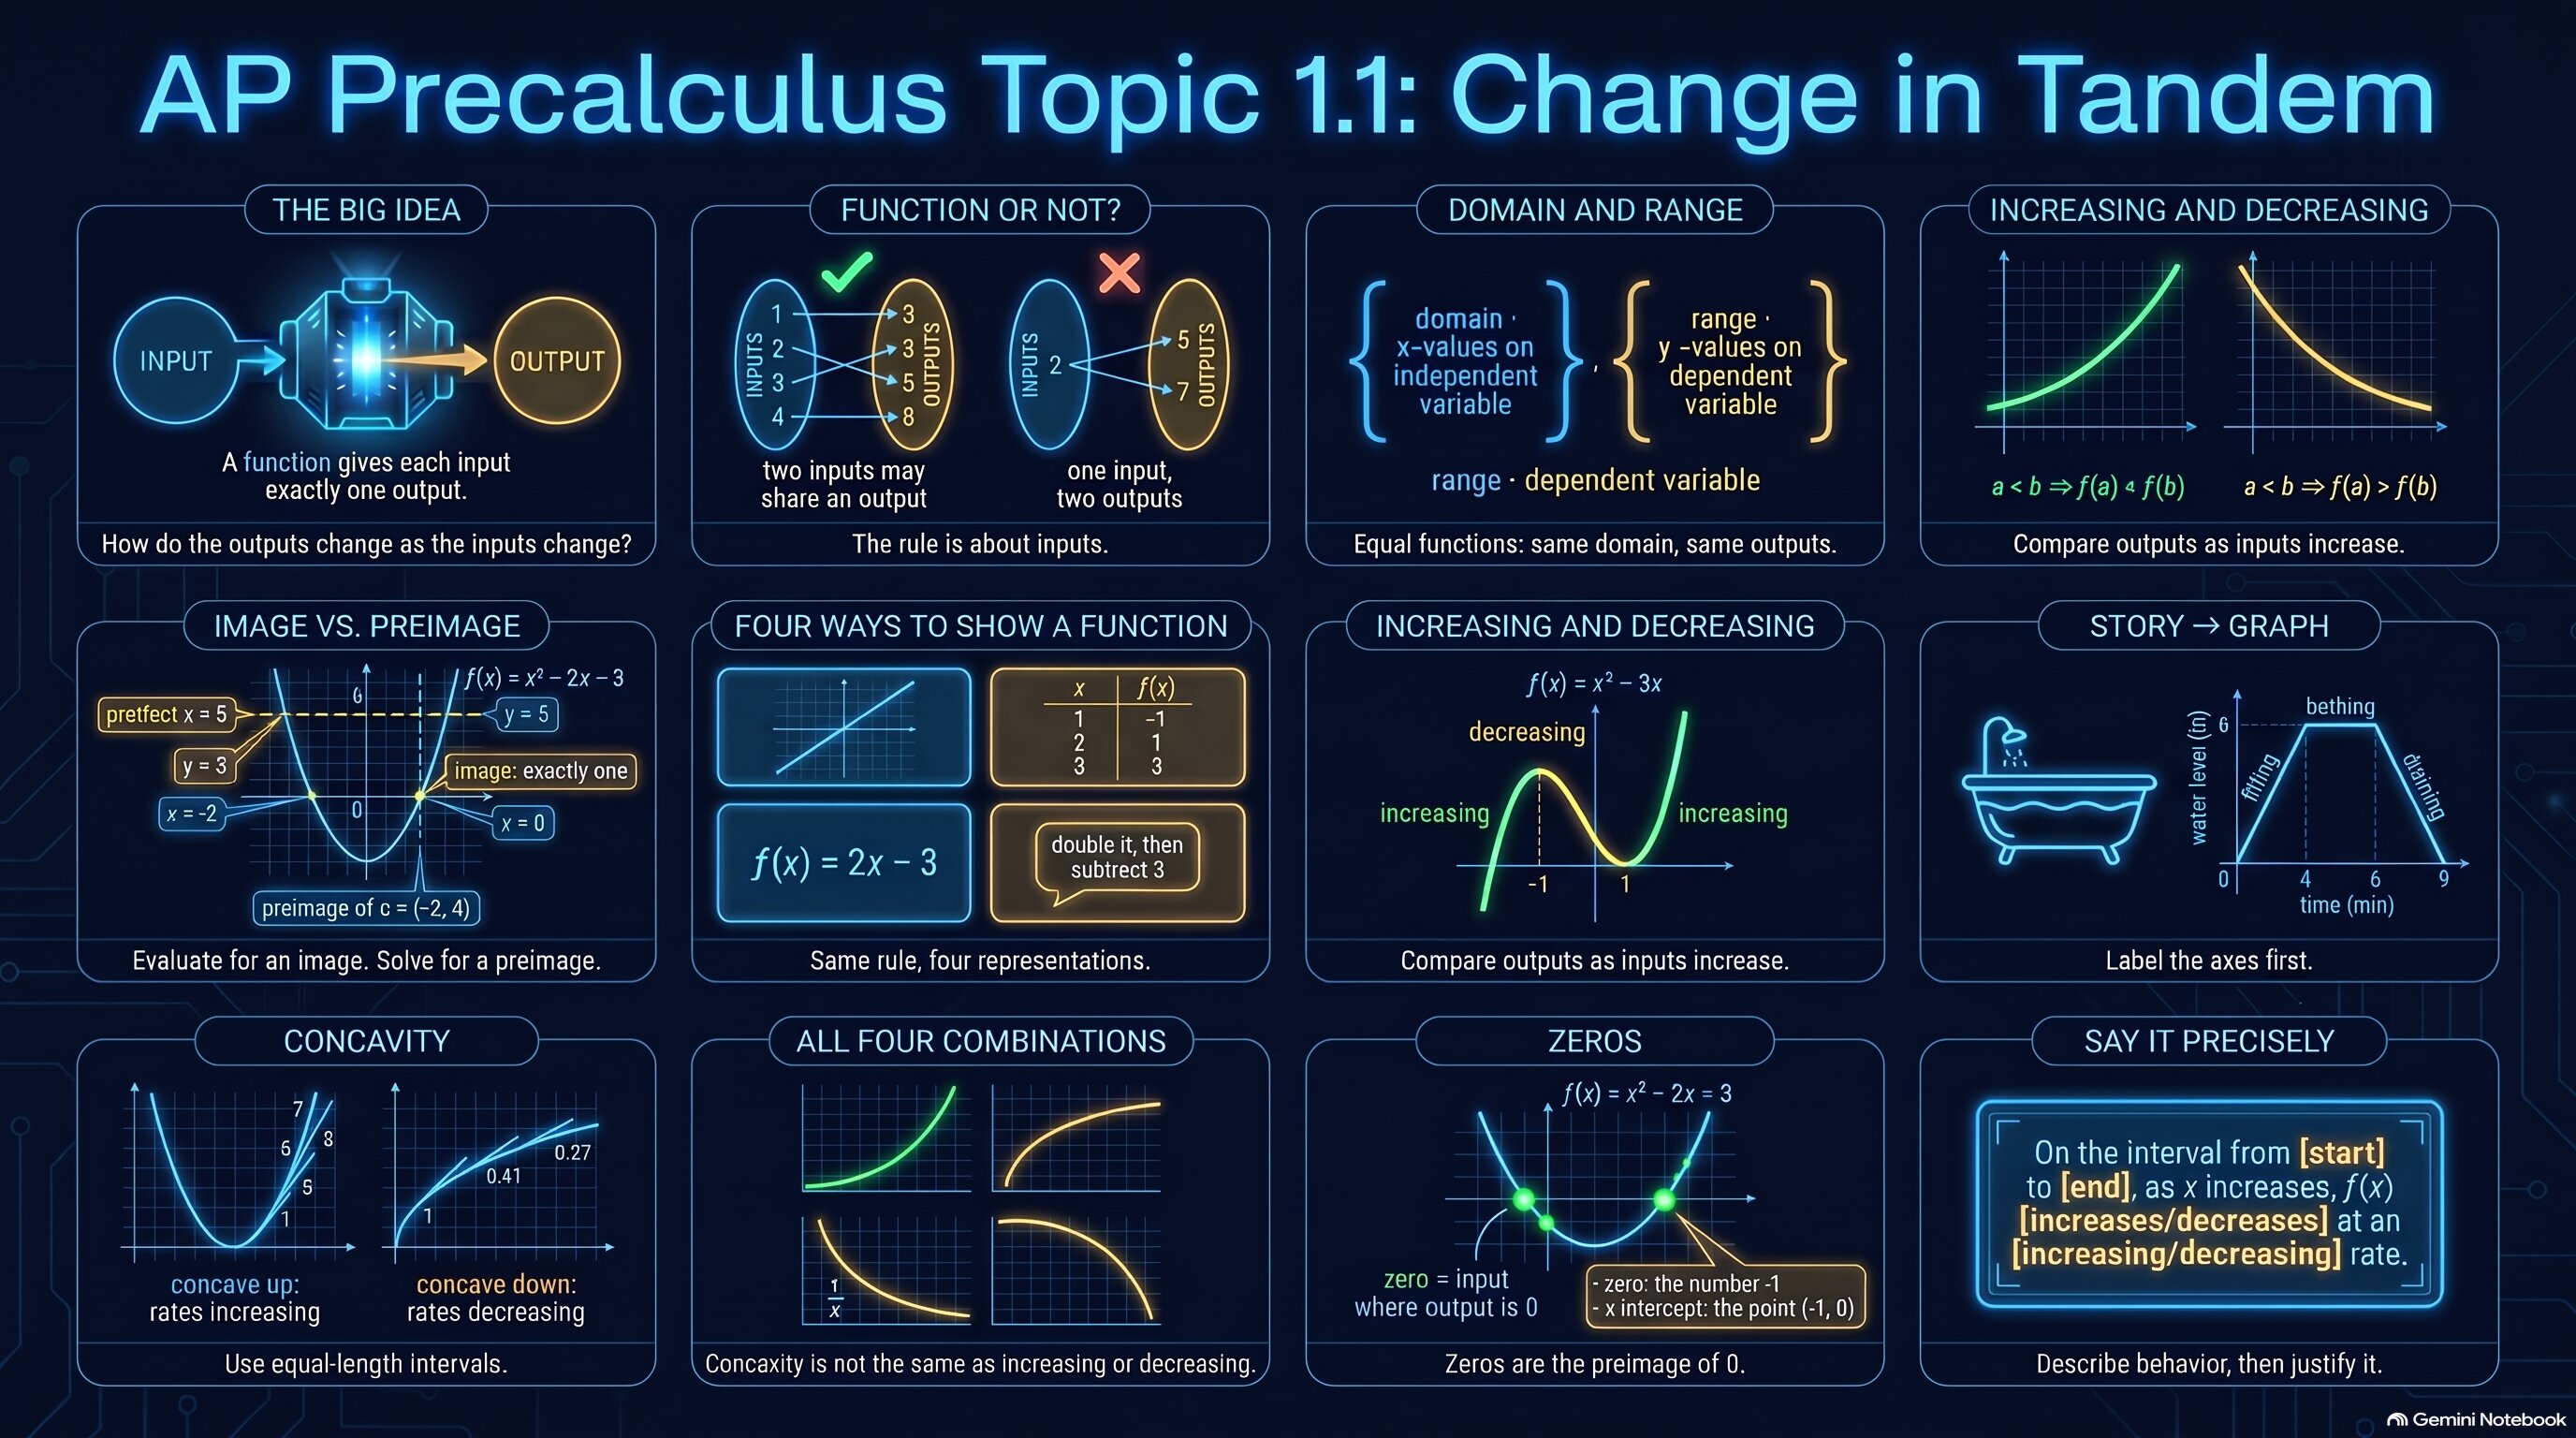
Use this as a quick reference for functions, image and preimage, increasing and decreasing, graphs and verbal descriptions, concavity, and zeros.
🧭 Plot Summary
Precalculus starts with a simple question: when one quantity changes, what does the other one do? A function pairs every input with exactly one output, and the story of a function is how those outputs behave as the inputs increase. Sometimes the outputs rise, sometimes they fall, and sometimes they do it faster and faster or slower and slower. This lesson gives you the vocabulary — increasing, decreasing, concave up, concave down — to describe that behavior precisely, whether the function arrives as a table, a graph, an equation, or a sentence.
What you'll do in this lesson
- Define a function as a rule giving each input exactly one output; name the domain, range, independent and dependent variables, and when two functions are equal.
- Find the image of an input and the preimage of an output in any representation: graph, table, equation, or words.
- Describe where a function is increasing or decreasing by comparing function values.
- Read a graph as a set of input–output pairs, and build a graph from a verbal description.
- Use concave up and concave down to describe a changing rate of change.
- Connect zeros of a function to where its graph meets the x-axis.
Why it matters
Every later topic in this course — rates of change, polynomials, exponentials, trigonometry — is described with these same words. Get fluent here and the rest of the course reads like a familiar language.
✅ Self-Check Before You Move On
Check off each item as you get there. These aren't grades — they're your own signal.